Take control of your large-scale Juju deployments
JAAS is Juju for enterprise.

Main JAAS components
Backend API server (JIMM)
JAAS has a backend API server (JIMM) that is responsible for managing all interactions with the downstream, Juju controllers.
Admins and users can interact with this service through the same Juju CLI and Terraform Provider for Juju.
Dashboard
A graphical user interface to simplify common administrative operations.
Why use JAAS?
Have to manage multiple Juju controllers
JAAS simplifies the provisioning and lifecycle management of controllers and charms at scale, automating activities like model migrations and controller upgrades
Need to meet tighter security and compliance requirements
JAAS offers additional security features like single sign on (SSO) on both the dashboard and the cli, permission management, fine grained juju controller activity auditing and soon an SSH proxy and service accounts for the Terraform provider
Prefer to interact with your system with a web interface
The dashboard offer a simplified way for administrators to perform common administrative operations and monitor the state of the deployment
Enhanced control and visibility
for your Juju deployment
JAAS is your centralised enterprise control plane for Juju deployments.
With JAAS you can:
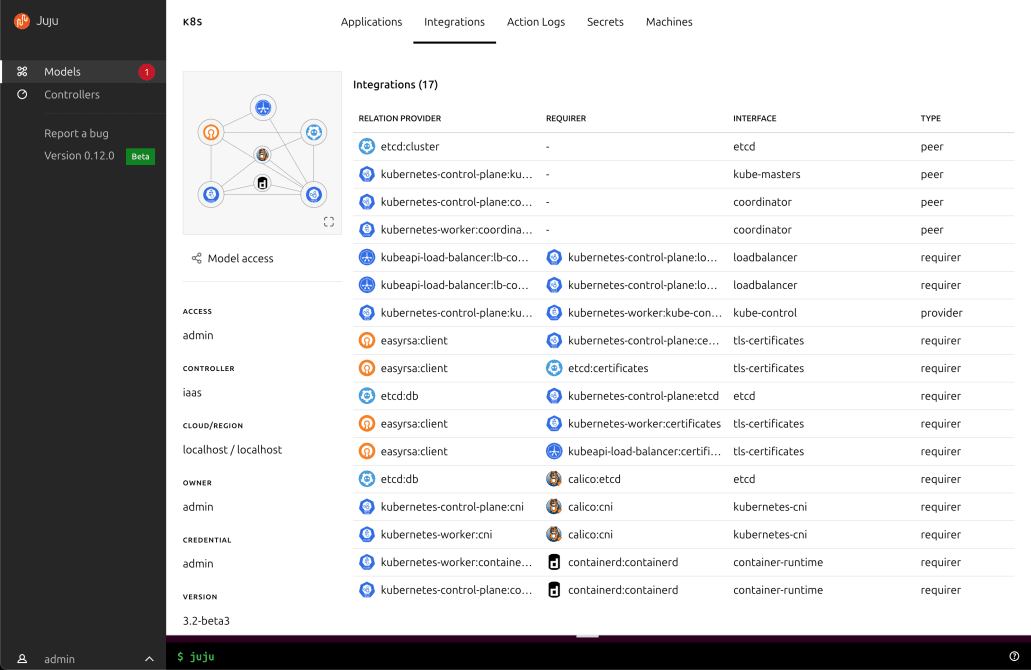
Drill down to view the details of everything that is deployed inside a model, such as applications, integrations, units, and more.
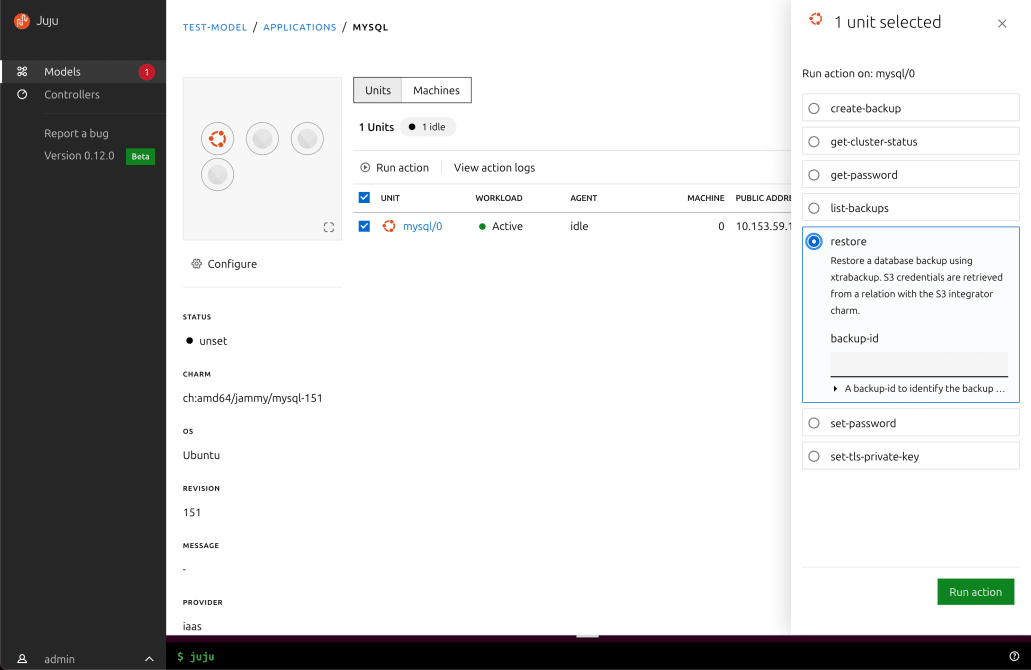
Execute Juju action from the UI and view the resulting logs to confirm their status.

Perform common administrative operations and apply machine configurations.
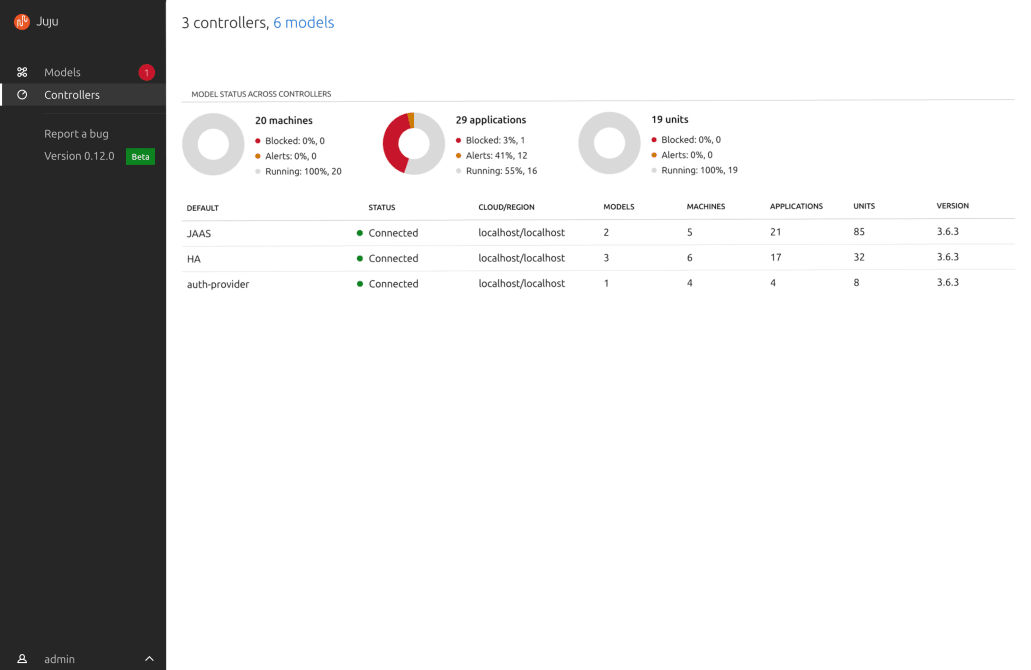
Onboard controllers and add, remove or manage user access to models and controllers.
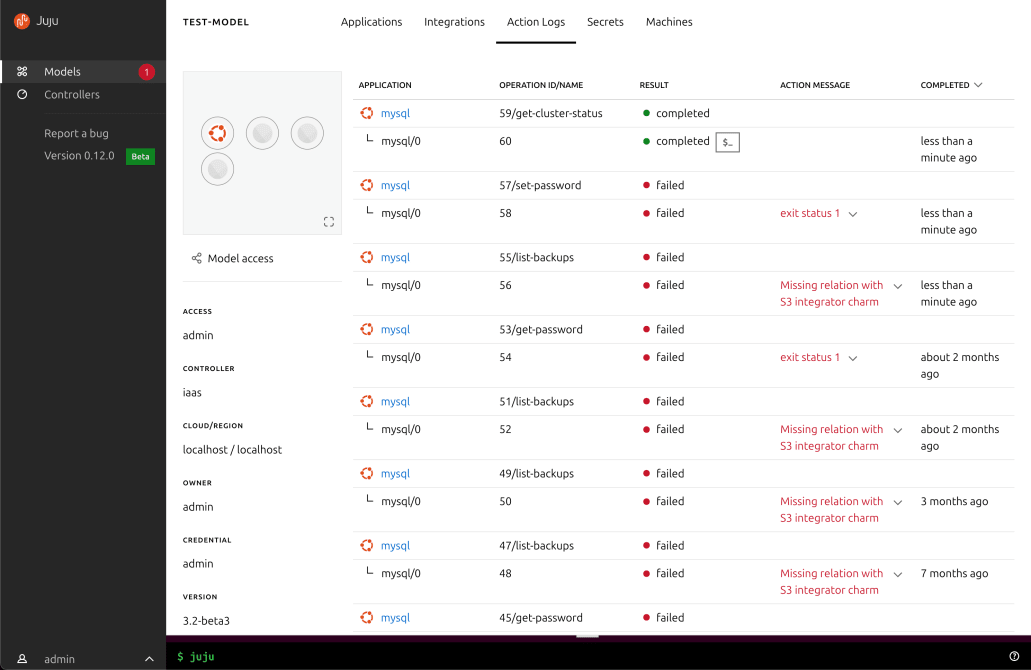
Access the logs from your deployment in a single, centralised location.
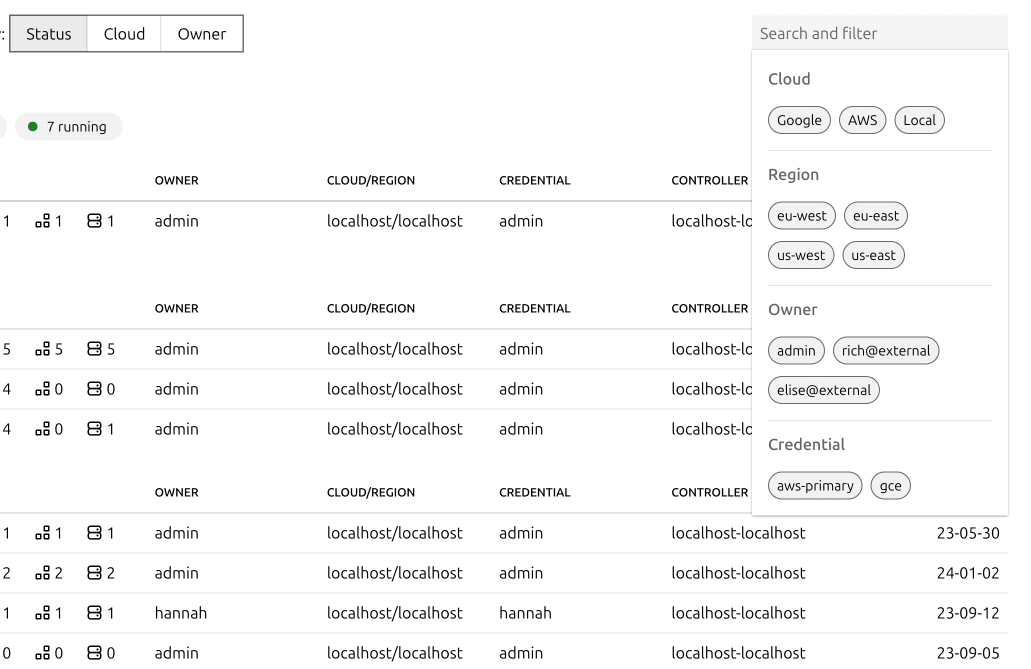
Perform complex searches/filters through your entire deployment and share the result through a unique URL.
Familiar experience and tighter
security controls
Centralised Terraform Provider
JAAS can make use of the Juju Terraform provider to apply plans to all managed controllers. The provider supports Oauth client credentials authentication and its access is controlled by the authorisation system.
SSH Proxy
(Coming soon)
Administrators can use JAAS to SSH into all units of managed controllers, reducing the need to grant access to vast areas of the network.
SSH access can be granted through a fine grained entitlement and session logs are kept in a tamper proof audit log.
Single sign on (SSO)
JAAS supports integration with external identity providers through OIDC, enforcing strong authentication on both the cli and the web dashboard

JAAS is available
through Ubuntu Pro
You can deploy JAAS on your infrastructure with an Ubuntu Pro subscription. Ubuntu Pro is a comprehensive subscription from Canonical which includes:
- JAAS charms and sample Terraform plan
- Access to our world-class technical team and knowledge base
- Security patching for all your software
- Option of a dedicated Canonical support engineer on your premises
- 24/7 phone, portal and email support (optional)
Canonical products are trusted by 10,000+ engineers at